

ESI uses a variety of data sources to help us better understand the world around us and the issues facing our clients. One of those primary sources is the American Community Survey (ACS) from the United State Census Bureau. Each year, the ACS provides a detailed snapshot of changes in key measures like population, housing, and workforce, allowing local officials, community stakeholders and the public better understand their communities. This post digs into the most recent release of ACS data to give a view into affordable housing trends exhibited in Philadelphia from an economic perspective.
Supply
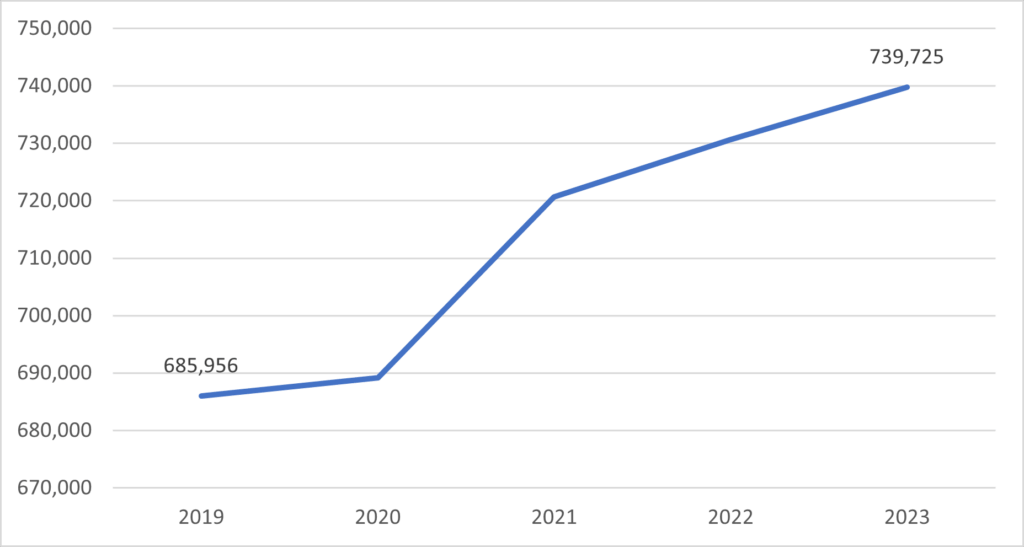
The total number of housing units in Philadelphia has grown steadily since 2019 – reaching approximately 740,000 in 2023.
Housing Units, Philadelphia 2019 – 2023
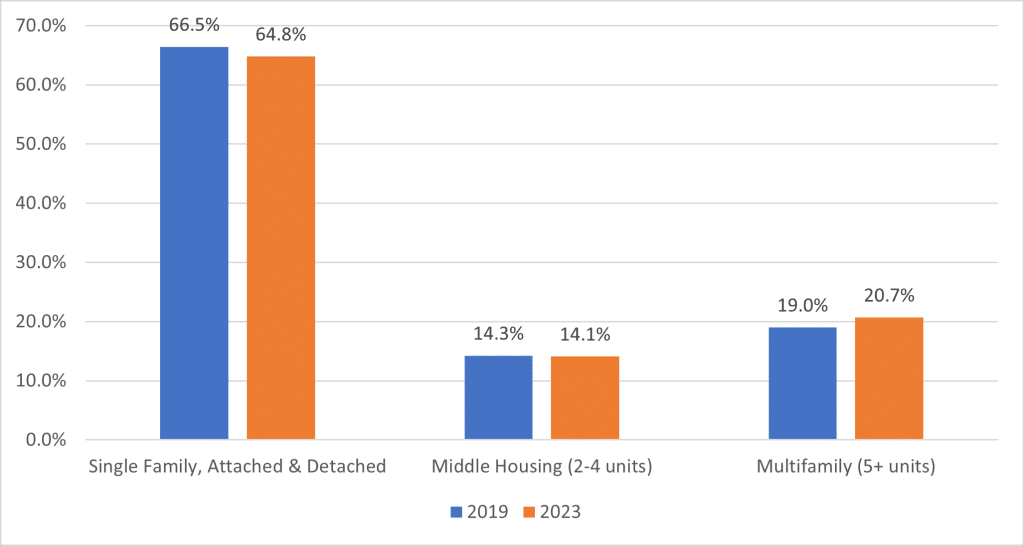
This growth has primarily occurred within units in multifamily buildings – growing in absolute terms by approximately 17% over the past five years and representing approximately 21% of Philadelphia’s total units in 2023.
Structure Type, 2019 and 2023
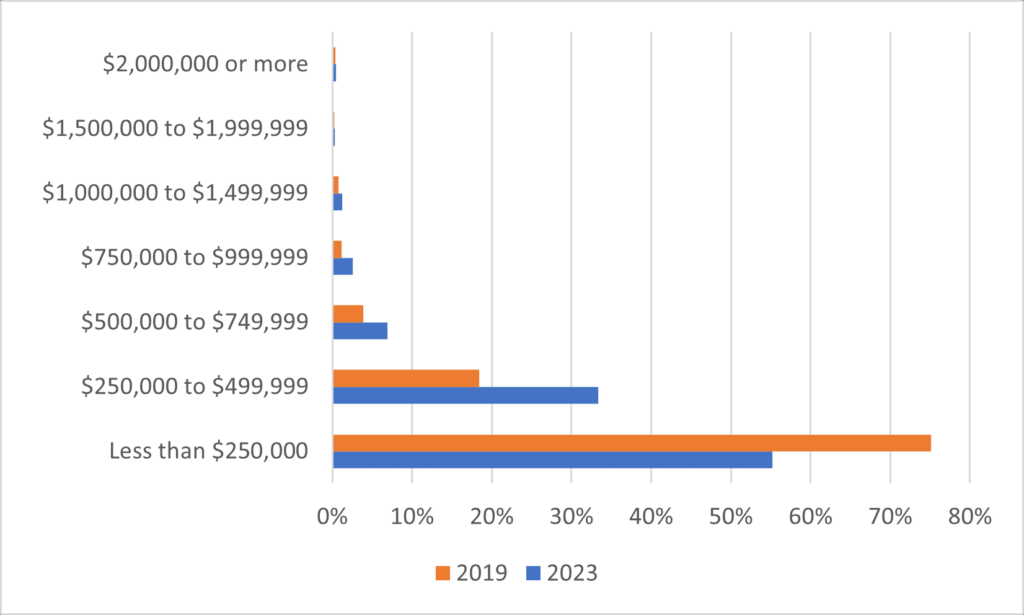
Like every housing market, this supply is split between renters and homeowners. Philadelphia’s occupied housing units are closely split between the owner and renter market, with 52% owner occupied and 48% renter occupied. Notably, the price of these units varies widely, and has increased in both real and nominal terms due to COVID-period house price appreciation and growing demand due to household formation. On the owner-occupied side, both the value of units and the value of selected monthly owner costs (or the sum of mortgage payments and utilities for an owner-occupied unit) have grown. In 2019, 75% of owner-occupied housing was worth 250k or less, in 2023 only 55% of own-occupied units fit that criteria.
Owner-Occupied Housing Unit Value, 2019 and 2023
Similar cost growth has been experienced on the rental side – where gross rents (or effective rents) and listed rents have both grown substantially since 2019 – notably a period of high inflation and wage growth. In 2019, 46% of renter-occupied housing had gross rents less than $1000, in 2023 that has decreased to 27%.
Gross Rent of Renter-Occupied Units, 2019 and 2023

Using estimates on available public and subsidized housing (or rent and income-restricted housing), approximately 5 percent of the total units in Philadelphia are dedicated affordable housing units. Assuming many of those units are not in single-family structures, approximately 15%of the total units in middle- and multifamily structures are dedicated affordable housing units. As a portion of the city’s renter-occupied units, these dedicated affordable units represent approximately 12% of the total unit count.
Demand
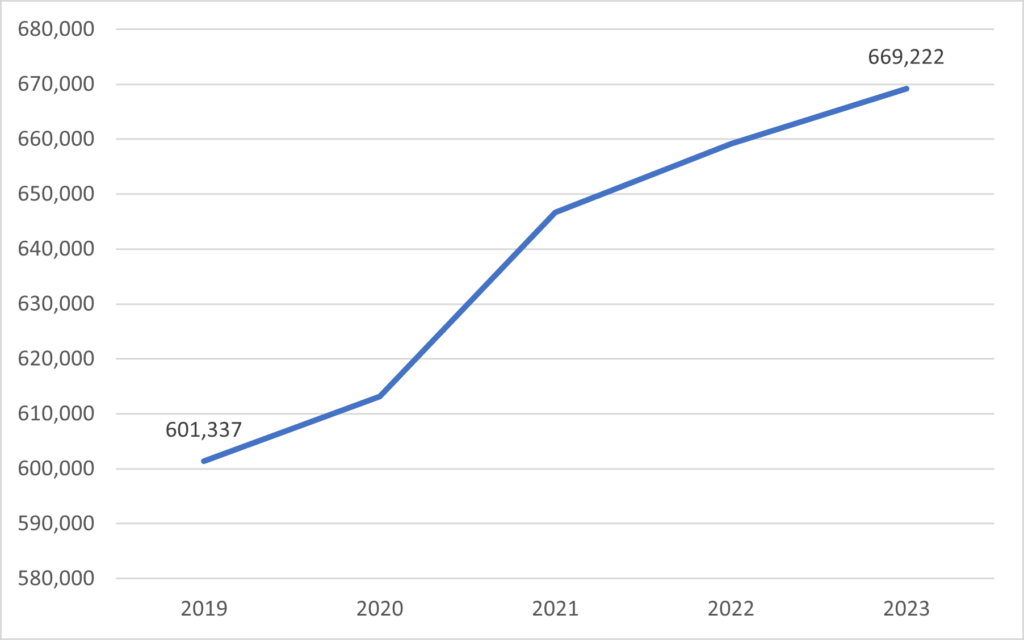
While Philadelphia’s population has remained largely static over the past five years, the number of households – inclusive of both family and nonfamily households– has grown by approximately 11% since 2019. This change implies a decreasing average household size, which is a product of generational change (age) and changing patterns of household formation.
Population, 2019 to 2023
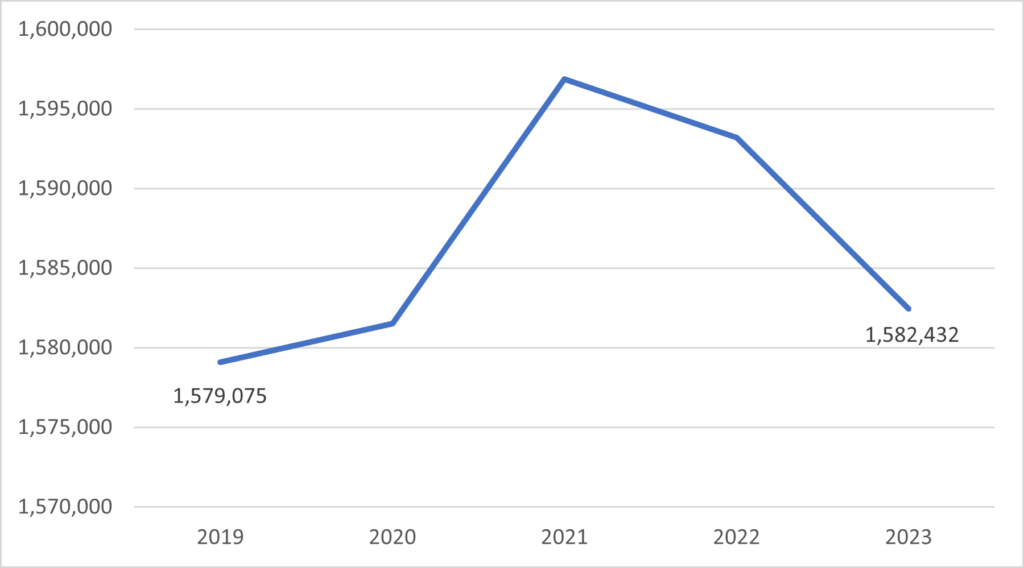
Number of Households, 2019 to 2023
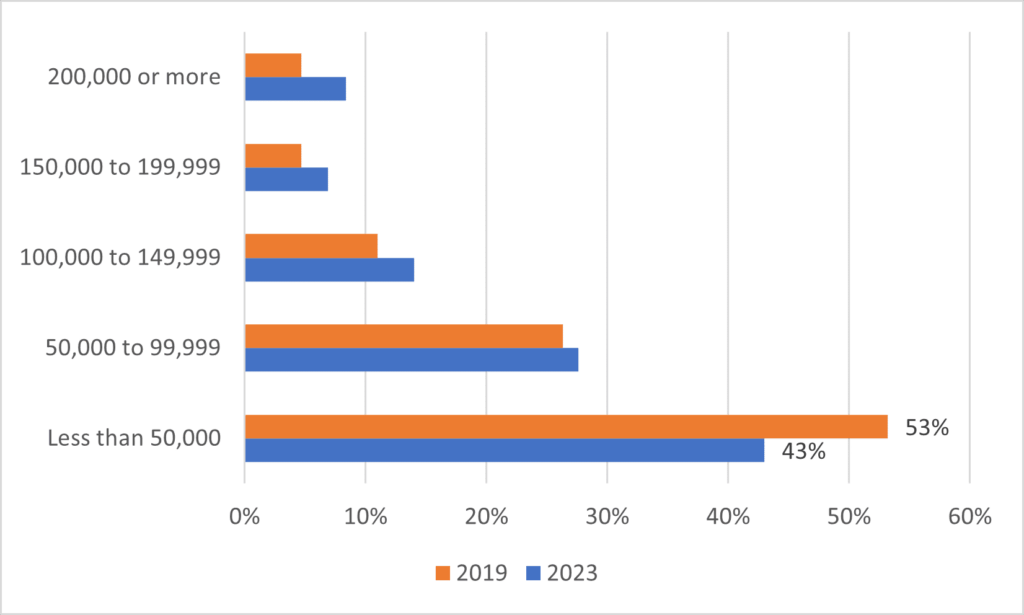
At the same time, Philadelphia has experienced growth across multiple household income bracket populations – with growth strongest amongst middle- and upper-income brackets – while the estimated count of households with lower-incomes has fallen.
Household Income, 2019 and 2023
The overall unit vacancy rate since 2019 in Philadelphia has fallen from approximately 12 percent to approximately 10 percent. Within the rental market, vacancy reached approximately 6 percent and within the owner-occupied market, approximately 1 percent of the total unit inventory was for sale – both have experienced a general downward trend since 2019. In part, this has coincided with and been impacted by rising interest rates and general tightening within the lending market.
Vacancy Rate, 2019 to 2023

Affordability
Ultimately, housing affordability is relative to a household’s income. Those paying more than 30 percent of their respective monthly household income are identified in the ACS as “cost burdened.” Based on this standard, an affordable rent for a household making $50,000 – approximately $1,250, or 30% of the monthly household income – would be much smaller than the affordable rent – approximately $2,500 – for a household making $100,000.
As of 2023, 49 percent of Philadelphia households in rental units were cost burdened, while 32 percent of owner-occupied housing units with a mortgage are cost burdened. When broken down by income, the affordability story becomes clearer. The tables below show the proportion of cost burdened renters and cost burdened owners within different income brackets. In 2019, approximately 71% of renters making less than $50,000 were cost burdened, a figure that increased to 76% in 2023. Within the middle-income bracket, the cost burden proportion shifted from 16% in 2019 to 28% in 2023.
| Household Income <$50k | Household Income $50-99k | Household Income >$100k | ||||
| Housing Cost as Share of Income | 2019 | 2023 | 2019 | 2023 | 2019 | 2023 |
| Less than 20.0 percent | 4% | 4% | 41% | 24% | 80% | 76% |
| 20.0 to 24.9 percent | 5% | 3% | 24% | 25% | 11% | 13% |
| 25.0 to 29.9 percent | 9% | 6% | 16% | 20% | 4% | 6% |
| 30.0 to 34.9 percent | 9% | 7% | 8% | 13% | 1% | 2% |
| 35.0 to 39.9 percent | 7% | 7% | 4% | 7% | 0% | 1% |
| 40.0 to 49.9 percent | 11% | 13% | 2% | 5% | 0% | 0% |
| 50.0 percent or more | 44% | 49% | 1% | 3% | 0% | 0% |
| Not computed | 11% | 10% | 3% | 3% | 3% | 2% |
Conclusion
The current data highlights the affordable housing needs of Philadelphia’s population – showing that housing affordability has become a greater challenge for lower- and middle-income households from 2019 to 2023, even as incomes have grown – a reminder that the housing market cannot be viewed in a vacuum, and affordability remains relative to household incomes. On the renter side, there is a growing need for units available at the lower- and middle-income income levels. Homeownership can be a more cost-effective – and even affordable – option across the income spectrum but maintains an exceedingly high barrier to entry due to limited inventory and high up-front costs to prospective buyers.

Stephen Madsen, Director | [email protected]
Stephen Madsen is a director at Econsult Solutions, Inc., providing expertise in housing and economic development policy analysis. In 2020, Mr. Madsen earned his Master’s in City and Regional Planning from the Rutgers University Edward J. Bloustein School of Planning and Public Policy. In 2012, Mr. Madsen earned his Bachelor of Arts in Political Science from the College of the Holy Cross.